


Russia has suffered many hardships and its history is truly dramatic. Over the past century it saw several regional conflicts, fought two world wars and experienced the Cold War. As a result of these events and their consequences, the world witnessed the collapse of two established political systems in Russia and tremendous geopolitical and economic change. At different times Russia ceded its land and gained new territories, made political concessions and achieved impressive victories in the global political arena, fought financial and economic crises and went through periods of unbelievable economic upturns.
Today any responsible Russian would ask: How has modern Russia benefited from the reforms? How much more effective is Russia compared with the Soviet-era Russian Federation? What does the future have in store for Russia?
To answer these questions we carried out a comparative analysis of the key indicators of Russia’s development during two periods in its history – as a federative republic within the Soviet Union (RSFSR, or Soviet Russia) during the period of reconstruction after World War II from 1945-1960, and the establishment of an independent Russian Federation (RF, or modern Russia) after the breakup of the Soviet Union in 1995-2010. The starting point for the study was 1995, not 1991. This gives the new Russia somewhat of an advantage because World War II and the Cold War had different results. In 1945 there were no destructive forces; the Soviet Union had expanded its territory and influence in the world, which contributed to the rapid start of economic growth. The country’s development following the collapse of the Soviet Union was affected by inertia which continued until 1998. On the other hand, it would be unfair to give the new Russia too much of an advantage compared to Soviet Russia, as the government had the chance to reverse the situation and use the advantages of the market economy as early as in the middle of the past decade.
WHAT RUSSIA LOST
To understand what Russia gained in 1945-1960 and in 1995-2010, we need to first understand what it lost.
Figure 1. Russia’s losses after WWII and after the breakup of the Soviet Union
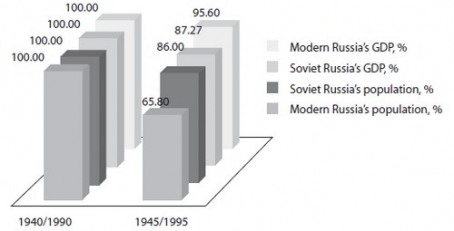
During the war years of 1941-1945, the Soviet Union lost almost 27 million people (Russia alone lost around 14 million) and millions more were disabled. In Soviet Russia, 1,710 towns and cities were destroyed; some of them did not have any undamaged buildings left standing. Around 71,000 villages were burnt down completely. Thirty thousand industrial enterprises, thousands of bridges and crossings, hundreds of thousands of railways and highways were destroyed. During the war the country reconfigured its economy to suit the needs of the military. Due to the loss of population, enterprises and various infrastructures, GDP in the areas liberated from Nazi occupation plunged by more than 30 percent. [1,2] However, thanks to the unbelievable courage of each soldier and worker on the home front, the Soviet Union’s GDP only fell by 14 percent on average [3, 4, 5] compared to 1940.
The losses caused by the collapse of the Soviet Union were no less significant and even far more severe in some respects. Population change was insignificant during this period compared with other indicators – a mere 4.4 percent difference,[6] whereas GDP at Purchasing Power Parity (PPP) was quite dismal. In 1991, PPP in Soviet Russia exceeded $1.9 billion (the Soviet Union’s GDP totaled 3.1 billion dollars by the time of its collapse, while several years before it was worth 3.5 billion dollars). [7] In 1995, PPP in the Russian Federation plunged 34.2 percent to 1.25 billion.8
Demography aside, it appears that the Soviet Union had a more stable position economically, geopolitically, and militarily after the war. This is hardly surprising because the Soviet Union won the war, while the Russian Federation was the clear loser after the Soviet Union’s collapse.
WHAT RUSSIA GAINED
We used average values when studying the dynamics of GDP because there is a tremendous number of sources that cite various figures (during the Soviet-era the difference was largely due to propaganda trends and the lack of transparency of the Soviet system; it was only in 1989 that the Soviet Union officially published its GDP statistics).
Gross Domestic Product. Soviet Russia’s GDP grew an annual 9.11 percent on average from 1945-1950, while the Soviet Union’s GDP increased around 14.7 percent9 in the period. Such high economic growth is explained by the initial strong positive impulse after the victory in the war (despite many difficulties and a famine): free labor from millions of prisoners-of-war and convicts, as well as the “dividends” of the Great Victory and all its derivatives. In the Soviet Union the growth rate was still higher due to intensive rebuilding programs in devastated territories. From 1995-2000, Russia’s GDP grew a mere 1.81 percent10 because of the persisting economic recession, the 1998 financial crisis and, most importantly, the government’s inability to reverse the situation.
The period from 1951-1960 posted an average growth of 5.81 percent, while the period from 2001-2010 saw growth of 5.07 percent (5 percent according to the consensus forecast for Russian GDP growth in 20109). In 2009, GDP fell 7.9 percent due to the powerful influence of the world financial crisis upon the fledging economy, the outflow of foreign capital (partially caused by the short-lived Russian-Georgian conflict in August 2008), a slump in business activity, and plunging confidence among the business community and the Russian population in general.10 Overstocking was another major factor, caused by a sharp decline in consumption and business activity. Once consumer confidence rebounds the stockpiles of goods will sell quickly and we might expect a quick economic recovery.
Figure 2. GDP growth, starting from 1945 for Soviet Russia and 1995 for modern Russia
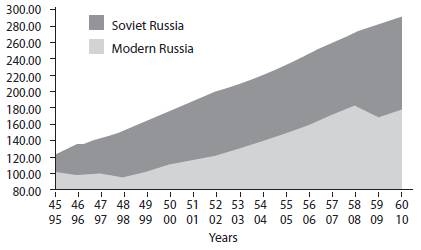
GDP 5 in Soviet Russia increased 271 percent by late 1960 compared to 194 (the Soviet Union’s GDP grew 450 percent on average9 according to various sources). The Russian Federation’s GDP grew 175.5 percent10 from 1995 to late 2010.
It is important to understand that the GDP estimate is based on the assumption that the quality of product and its competitiveness remain unchanged. Yet this is not the case in the real economy. To measure the real economic growth rate, we have to compare per capita GDP growth (Fig. 3).
Figure 3. Per capita GDP growth from the beginning of the period (1945/1995)
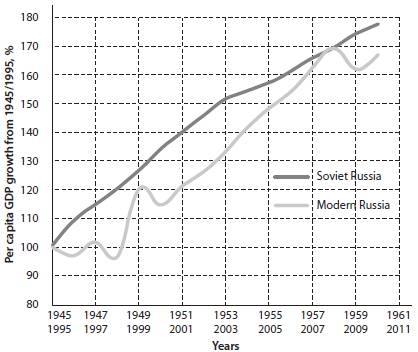
A comparative analysis provides unexpected results: Soviet Russia and modern Russia developed along similar lines according to per capita GDP. Furthermore, this indicator grew faster in the past decade than in the Soviet era, with the annual increment reaching 5.21 percent on average, whereas from 1950-1960 it amounted to 4.35 percent. Per capita GDP will have increased over 5 percent by the end of 2010.
The important conclusion therefore is that the pace of per capita economic development in Soviet Russia was practically the same as in modern Russia.
There is a difference though. Despite the fact that per capita GDP growth rates were approximately the same and GDP grew faster from 1945-1960, a contemporary Russian is twice as rich as his/her counterpart in 1960.
Fig. 4 correlates the size of the economy and per capita GDP in 1960 and 2010, denominated in 2009 U.S. dollars.
There is another advantage over the Soviet era: in addition to the fact that a Russian today has a higher purchasing power, there is not a shortage of goods or of foodstuffs in the country. This factor is quite significant.
The present article will not address all the reasons behind the shortage of foodstuffs and consumer goods in Soviet Russia and their abundance in today’s Russia. In short, this is explained by the tremendous difference in the size of the two economies. Despite years of economic devastation in the 1990s, Russia’s GDP in 2010 is much higher than in 1960 (Fig. 4a). In other words, the food budget of Soviet Russia in 1960 amounted to some 4 percent of GDP, whereas in 2010 the allocations for these needs do not exceed 1.6 percent. A larger food sector in Russia today explains the abundance of food products. The situation with other products and services is similar, and sharply contrasts with Soviet-era shortages.
Figure 4. Russia’s economic indicators in 1960 and 2010 denominated in 2009 U.S. dollars; a) GDP, b) per capita GDP
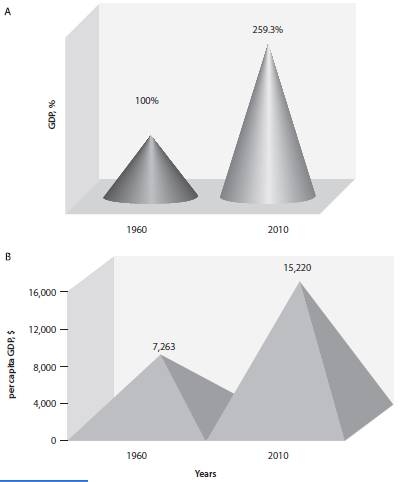
Figure 5. Economic structure; a) Soviet Russia 1960 [2,11], b) modern Russia 2010 [10]
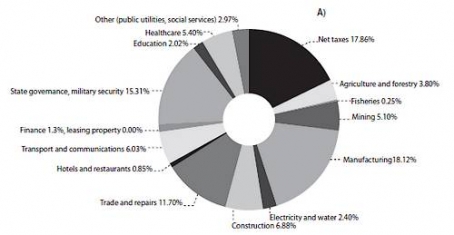
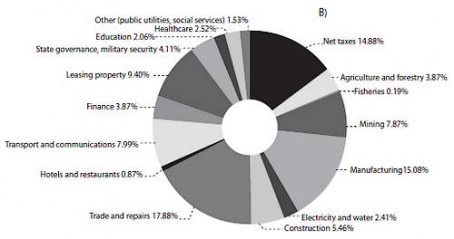
The structure of the Russian economy. Russia’s present economic structure was basically formed in the 1950s. It was then that the Soviet Union began to lay the foundation for a raw material-based economy, while in the 1960s one of its objectives was to secure the status of an energy superpower. The West successfully resisted this bid and the process dragged on for decades until modern Russia eventually coped with the task. While comparing the structure of the 1960 and the 2010 economies (Fig. 5), one should remember that the size has changed considerably. GDP in 2010 approximates 1990 GDP, but vastly exceeds 1960 GDP in absolute value. For example, while mining accounted for 5.1 percent of GDP in 1960, this sector’s share rose to 7.87 percent in 2010; oil production increased by 238.3 percent and gas production soared 7,458.5 percent. It should be remembered, however, that mining is just a part of the oil and gas sector which accounted for some 25 percent of GDP in 2010.
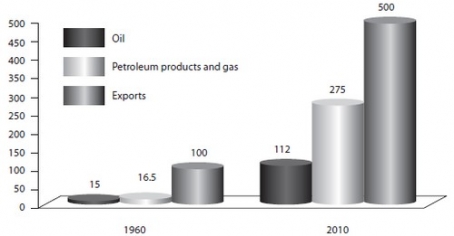
Exports in 2010 exceeded those of 1960 more than five-fold. Oil exports (excluding petroleum products and natural gas) in 2010 exceeded 1960 levels 7.5-fold (Fig. 6).
Figure 6. Growth of Russian exports in 2010 compared to Soviet Russian exports in 1960
Modern Russia is dependent on exports of raw materials. The government’s economic modernization program has had little effect so far. We can hardly expect any tangible results from the start of modernization before 2015, whereas modernization itself might only prove beneficial by 2020. By that time electronic production, which is currently inadmissibly low, is expected to drastically increase. We expect that civil and naval shipbuilding – and aircraft manufacturing in particular – will gain a firmer foothold. We can also expect a breakthrough in the production of aerospace equipment. It does not pay to make forecasts for domestic car manufacturing, yet we presume that the production of foreign cars in Russia will increase. Moscow may turn into an international financial center. Yet these are just forecasts. Let us look at what the real situation was in 1945-1960 and in 1995-2010.
The development of industry – heavy industry in particular – was the key guideline for the economic development of the Soviet Union. It is not surprising that in 1948 industrial production exceeded the pre-war level.
The Soviet Union made tremendous efforts and achieved unbelievable results as it built more than 14,200 large enterprises. Production in the chemical and petrochemical industries soared more than 660 percent in 1945-1960, oil production skyrocketed 650 percent, gas production by 1,250 percent and coal production by 235 percent. Machine-building and metal processing boosted output by 600 percent. Production of steel and cast iron grew 430 percent, from 12.3 million tons and 8.8 million tons to 65.3 million tons and 46.8 million tons, respectively. The share of heavy industry in the Soviet economy was steadily growing: in 1945 it accounted for 60 percent compared with 40 percent for light industry. By 1950 it had reached 68.8 percent against 31.2 percent, and by 1960 it stood at 72.5 percent against 27.5 percent. Labor productivity increased 50 percent from 1945-1950 due to mechanization and initial automation in industrial production. It increased 200 percent in the period from 1945-1960.
These impressive results, compared with those of modern Russia, are shown below (Fig. 7).
Of course industrial production is not growing at such an impressive pace at present, but it would not be quite correct to compare industrial growth indicators as a percentage. Although 1940 is generally regarded as the end of industrialization, it was only in 1960 that industrial production in Soviet Russia could form a ratio to other sectors of the economy.
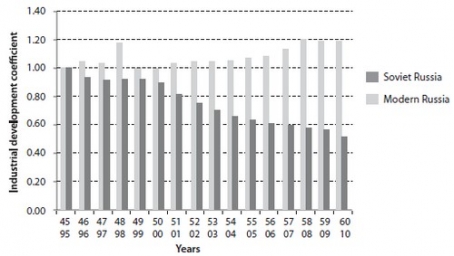
The growth of industrial output can be analyzed using the industrial development coefficient as a ratio of GDP growth to the growth of industrial production. This coefficient reveals the dynamics of the growth of other sectors of the economy with respect to industry (Fig. 8).
In 1960, the share of industrial production in GDP was around 55 percent, and later this indicator reached 60 to 70 percent, whereas it does not exceed 40 percent (37 percent in 2009) in today’s economy. But the ratio of industrial production to other sectors is not an indicator of the standard of living or a country’s competitiveness. Overall, the value of 37 percent is higher than in a majority of Western countries, yet Russia still lags behind its Euro-Atlantic rivals in standards of living and per capita GDP.
Figure 7. Industrial output increase
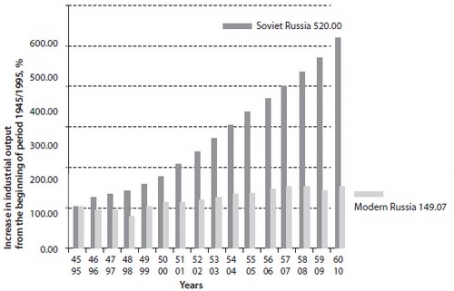
Figure 8. Industrial development coefficient
In 1945 Russia dropped far behind in the number of cars, civilian aircraft, etc. It is hardly surprising that their numbers increased exponentially until 1960, not to mention aerospace equipment, whose production was only launched in the 1950s.
An increase in consumer goods lagged far behind overall industrial growth because a command economy divides all production into two main categories: Group A – production of the means of production, and Group B – production of consumer goods. Group A production was ahead of Group B, as the militarized, industrialized economy of the Soviet Union continuously demanded a high level of Group A development. Such division does not necessarily imply that the production of the means of production is a net investment in the future of the country, i.e. the future exponential growth of output. Were it otherwise, the Soviet Union would have beaten all countries in terms of output before 1980, including the U.S. This did not happen. Moreover, the Soviet Union suffered consistent shortages of consumer goods.
Modern Russia has cut the production of consumer goods to an abysmally low level of 1.35 percent (against 8.50 percent in 1960), importing them instead in great quantities.
We will not compare production volumes of military equipment. As a militarized state, the Soviet Union not only set an objective to catch up with the U.S. and surpass it, but also kept preparing for a new world war.
As for the production of civilian equipment (aircraft and avionics, ships, buses, trucks, cars, tractors and farm equipment, refrigerators and other household appliances), growth rates in these fields were lower than overall industrial growth rates. The increase in the production of certain items varied in different periods. For example, the number of newly produced tractors began to fall after 1995, while Russia doubled tractor production from 6,500 to 12,500 from 2006-2008. The use of other farm machinery, along with crop yield, increased as well. At the same time the consumption of other products, such as cars, was on the rise. While comparing Soviet Russia and modern Russia in the vehicle-to-population ratio, we should remember that transport in the Soviet Union was mainly public. In the 1940s-1950s, cars were virtually unavailable for sale to private individuals. Therefore, a correct comparative analysis requires that we take into account passenger and public transport with regard to Soviet Russia in 1945-1960, while we only consider private cars for the period of 1995-2010.
According to our study, the number of cars in Russia increased 140 percent from 1945-1960, while the number rose 180 percent in 1995-2010. The increase in the number of cars in 1945-1950 accounted for an annual 6.15 percent, while it slipped to 5.35 percent in 1951-1960, compared to 7.49 percent and 6.13 percent in 1995-2000 and 2001-2010, respectively.
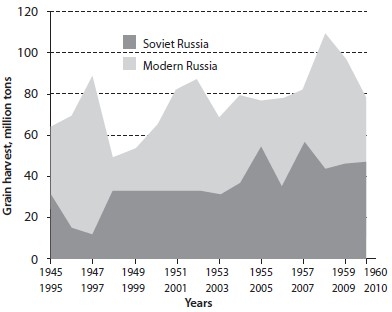
An analysis of the Russian grain harvest shows a promising picture (Fig. 9). A well-conceived food security policy has already yielded good results. Despite the devastating drought in the summer of 2010, the worst in more than one hundred years, Russia had a decent grain harvest.
Figure 9. Grain harvest in Russia [10]
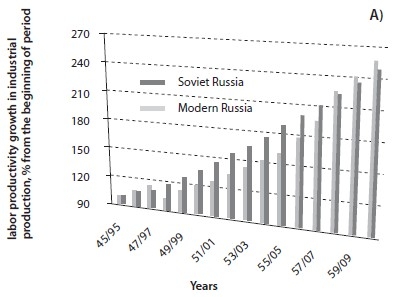
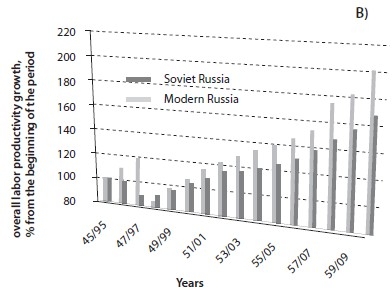
Labor productivity in Russia remains lower than in most developed countries, yet the growth rates of this indicator are very high (Fig. 10). 9, 10 Modern Russia outpaces Soviet Russia in both the average level of labor productivity and the growth of this indicator in all sectors of the economy, especially in agriculture and services. Furthermore, modern Russia shows higher labor productivity in industrial production in absolute values and in growth rates.
Figure 10. Labor productivity in Russia: a) industrial production, b) overall
Demography. Modern Russia has ignored population growth, a key development factor. The demographic crisis has already had very serious consequences, affecting the Russian economy and making it fall short of 95.8 percent of GDP growth. Russia needs a demographic boom, which would inevitably result in an upturn in the country’s economy.
From 1991 to the middle of the 2000s, Russia saw a dramatic decrease in population. However, the government succeeded in stopping the process and there has been a decrease in the death rate from 2003-2004. Birth rates began to increase starting in 1999. Migration has been showing upward trends as well. Hopefully Russia’s population will begin to grow steadily within the next one or two years, and its growth rates might develop into a baby boom by 2020.
The research shows that the average life expectancy in Russia was 57.2 years in the period from 1945 to 1960, while it increased to 66.3 years in 1995-2010.10 Life expectancy increased slightly from 1945 to 1946 due to the end of World War II, but then sharply decreased because of the 1946-1947 famine. By the end of the 1960s life expectancy had reached 63 to 67.5 years thanks to the country’s rapid development. By the end of 2010 it had increased to 66.7 to 68 years.
Therefore, the review of standards of living (without taking into account the level of comfort and availability of high technology) warrants the following conclusion on life expectancy: life in modern Russia in 1995-2010 is better than life in Soviet Russia in 1945-1960 by 15.9 percent on average.
DEVELOPMENT POTENTIAL
If we compare the most significant indicators of the country’s development as of the final year of the periods under review, we will get a clear picture of the dynamics of the country’s development and its potential.
The exponential coefficient is the relative ratio between evaluation indicators of modern Russia and those of Soviet Russia. It is calculated as the ratio of the best parameter to the worst. For example, in evaluating the rate of corruption, the best parameter is 0.02 for Soviet Russia and the worst is 0.3 for modern Russia, while the vehicle-to-population ratio is as follows: 240 private cars is the best parameter for modern Russia.
This study shows that today’s Russian Federation has a 2.17-fold advantage over Soviet Russia according to a broad range of comparison criteria. When starting this analysis, I assumed that today’s Russia could only boast a higher level of freedom, a fledging civil society and other insignificant advantages. But the results turned out to be quite reassuring and strengthened my belief in Russia’s tremendous development potential.
* * *
The backbone of the Soviet economy was built during the period of industrialization before 1940, and in the post-war period from 1945-1960. It was then that the Soviet Union posted its highest rates of growth. Although this momentum enabled the Soviet Union to develop for another two decades, the system failed after reaching its peak of growth in the 1970s. Essentially, the Soviet system toppled itself. One of the most important reasons was the stagnation of an economy built in the period from 1945 to 1960. The comfort, freedom and even lives of Russians were sacrificed for the country’s industrial development.
This decline dragged on until 1998. Nevertheless, Russia succeeded in overcoming all the difficulties.
Russians paid a high price in the 1940s and the 1950s for building the foundation of a national industry, and civil freedoms in the 1990s. It is only now that the new Russia has a truly excellent opportunity to develop into a strong and prosperous country.
Remarks
1 An interview with Gennady Chizhov, President of the LAD South-Ukrainian Center for Ethnic and Political Studies. Nedvizhimost, No.30, July 2009. – Russ. Ed.
2 The USSR’s Economy over 70 Years. Moscow: Finances and Statistics, 1987. – Russ. Ed.
3 Russia and the USSR in the Twentieth-Century Wars. Combat Losses: A Statistic Study. Ed. by Colonel-General G.F. Krivosheev. Moscow. 1993. – Russ. Ed.
4 Mikhail Gorbachev. The Lessons of War and Victory. Izvestia, May 9, 1990.
5 Soviet Casualties and Combat Losses in the Twentieth Century. Ed. by Colonel-General G.F. Krivosheev. London: Greenhill Books, 1997.
6 Federal State Statistics Service
7 Estimated value: According to the USSR Goskomstat, the figure is 1.6 billion rubles (about 2.7-3.4 billion 2009 U.S. dollars); Politika, No.47(508), December 2006; according to CIA Factbook, about 2.53 billion 2009 U.S. dollars) before the breakup of the Soviet Union; according to Boris Ikhlov (www.kprf.ru), GDP in 1990 amounted to 3.325 billion 2003 U.S. dollars. The actual value of GDP of the Soviet Union remains a disputable issue.
8 Data from the Federal State Statistics Service, CIA Factbook and the IMF.
9 Estimated value: The USSR’s Economy over 70 Years. Moscow: Finances and Statistics, 1987 – Russ. Ed.; The History of the USSR.Ed, by V.P.Ostrovsky, Moscow, 1990 – Russ. Ed.; Sergei Kara-Murza. The History of the Soviet State and Legislation. Moscow: Russia and the World, 1994 – Russ. Ed.; Geoffrey Hosking. A History of the Soviet Union. 1917-1991. 1985; Great Soviet Encyclopedia, 3rd edition. 1969-1978; Andrei Poletayev. Gross Domestic Product of the Russian Federation in Comparison with the United States, 1960-2004. Moscow, 2006.
10 Federal State Statistics Service
11 Great Soviet Encyclopedia, 3rd edition. 1969-1978


